BETT - Battery Electric Truck Trial

Deep Dive Analysis 1: Drive Cycle Assessment

The first of several publications looking deeper into the data to understand vehicle performance. Drive cycles are how we categorise the broad type of driving: urban, rural and motorway. This analysis investigates how the energy consumption varies by drive cycle and what factors affect the efficiency.

Key Points

  • Most vehicles are driven in a predominantly motorway drive cycle, i.e. high and consistent speed.

  • Including the effect of regenerative braking, the vehicles achieve 1.2 km per kWh on average.

  • With a 250 kWh battery, this gives an expected range of 305 km, 25 km more than the quoted range.

  • Rural driving achieves the best efficiency at 1.40 km per kWh, while urban the least at 1.03 km per kWh.

  • Regenerative braking recovers just over 20% of the drive energy in urban and rural drive cycles due to many braking events, but only 3% in the motorway drive cycle due to consistent speed.

  • The low efficiency for urban driving is due to the large number of acceleration events, and this could be improved with driver training.

Introduction to Drive Cycles

A drive cycle is how we categorise the broad type of driving. We use three categories: urban, rural and motorway, which represent typical driving patterns on these types of roads.

These categories originate from the three drive cycles of the same name developed for vehicle testing by the Artemis project which are in turn based on a statistical assessment of typical real-world driving.

The graph shows the speed trace of the three cycles: urban is slow with frequent starts and stops, rural is moderate but varying speed, and motorway is consistent high speed.

We categorise real data based on the statistical similarity of short periods of driving to the three drive cycles. Consistent high speed driving will be classed as motorway while slower start-stop movements will be classed as urban. It is not based on the designation of road actually driven on, so, for instance, slow moving traffic on a motorway could be classed as urban. We also split out idling as a separate category.

This graph is an example of the categorisation applied to a journey, also showing the power consumption. It demonstrates how the main high speed section in the middle is categorised as motorway, while the slower sections with varying speed are classed as rural or urban.

Drive Cycle Utilisation

The data shows that more than half of the distance driven for most vehicles is categorised as motorway.

Most vehicles are being used for urban deliveries within large cities, the dominance of motorway driving is explained by most deliveries being spaced far enough apart that there is significant driving on the ring roads surrounding these cities. Despite its name, rural here will also include driving on moderate speed (e.g. 40 mph) primary routes within the city.

Among the vehicles with less motorway driving, vehicle F-1 is being used for domestic deliveries and G-1 tends to stay within the city itself. I-1 is mostly used within the city but has occasional trips further afield.

Drive Cycle Energy Efficiency by Vehicle

Vehicles typically travel just over 1.2 km for every kWh used, which includes the effect of regenerative braking. This means that with a 250 kWh usable battery capacity the overall range is about 305 km. However, this varies significantly by vehicle and drive cycle.

Some of this variation comes from factors not yet assessed, including payload, weather conditions, gradient and driving styles. Future analysis will investigate these effects further to understand the variation and refine these results.

The average efficiency across all vehicles, including regeneration, is:

  • 1.22 km/kWh equivalent to a range of 304 km, for driving categorised as motorway.

  • 1.40 km/kWh equivalent to a range of 351 km, for driving categorised as rural.

  • 1.03 km/kWh equivalent to a range of 256 km, for driving categorised as urban.

Overall this is an average range of 305 km, 25 km higher than the DAF quoted range of 280 km.

Regeneration (the lighter shaded block) has a significant impact on energy consumption and range for urban and rural drive cycles.

Regenerative Braking

Regenerative braking occurs when the vehicle uses its motor as a generator under braking to recover some of its kinetic energy back into the battery.

The urban drive cycle provides the most regeneration opportunity: 26% of the energy used for propulsion is recovered, in the rural drive cycle the ratio is 22% while in motorway it is only 3%.

This graph shows the proportion of time spent at a steady speed and at various rates of acceleration and deceleration, for each drive cycle, averaged across all vehicles.

During the motorway drive cycle vehicles spend more than half the time at a steady speed, which drops to 20% for rural and 13% for urban. Conversely the motorway drive cycle spends less time accelerating and decelerating, while this is increased for rural and urban.

The additional time spent decelerating is what provides the greater opportunity for regeneration in urban and rural drive cycles.

Power Curves

Forces Acting on a Vehicle

To understand these results, we dive deeper into the power requirements of each drive cycle to understand why relatively low speed urban driving requires more energy per km than higher speed motorway driving, and why rural driving is more efficient still.

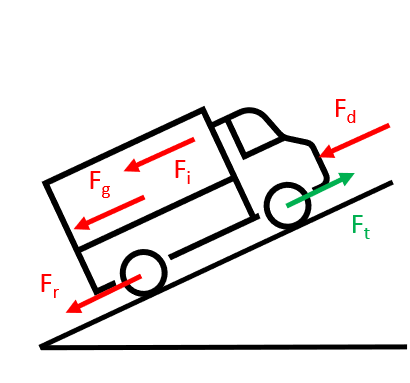
Power is required to deliver the tractive force (t) at the wheels to move the vehicle forward against opposing forces of:

  • Inertia (i) (when accelerating)

  • Aerodynamic drag (d)

  • Rolling resistance of tyres (r)

  • Gravity (g) (when ascending a gradient)

The most important factors in power consumption of a vehicle are the speed and acceleration demanded by the driver, and the gradient of the road.

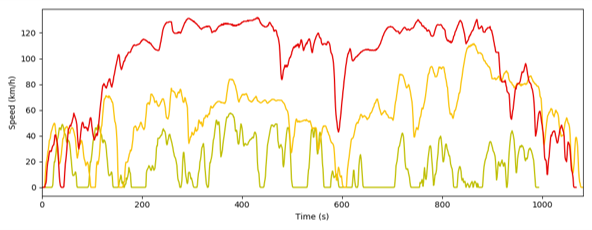
To help understand the reason for the different energy consumption for the three drive cycles, we calculate power curves. These show the instantaneous power required by the vehicle at specific speeds, accelerations and gradients.

These are created by isolating very short segments of telemetry data with a duration of less than 5 seconds (as illustrated above) during which the speed, acceleration and gradient are close to the values of interest. Many hundreds of such instances across all data for a vehicle are averaged to build the power curve.

Steady Speed

For this report we look only at the power requirements on flat roads. We start by looking at the power required at a constant speed. This is independent of payload, but will vary by factors such as wind, temperature and ancillary power loads.

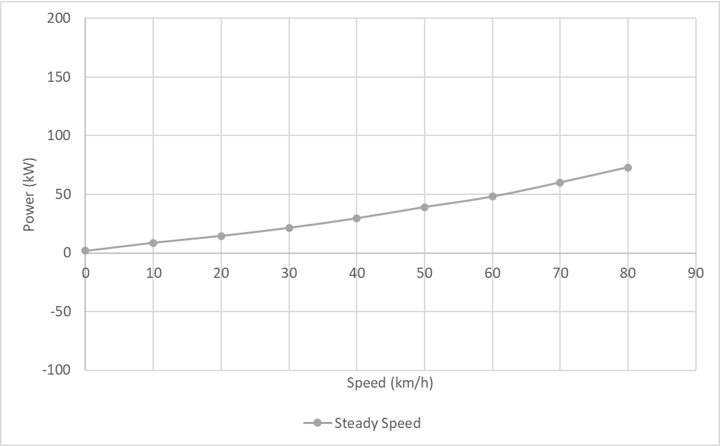
This graph shows the average power across all vehicles required to maintain a steady speed on the flat.

Typical urban speeds (30 to 50 km/h) require around 25 to 45 kW, maintaining the observed peak speed (80 km/h) requires around 70 kW.

Acceleration

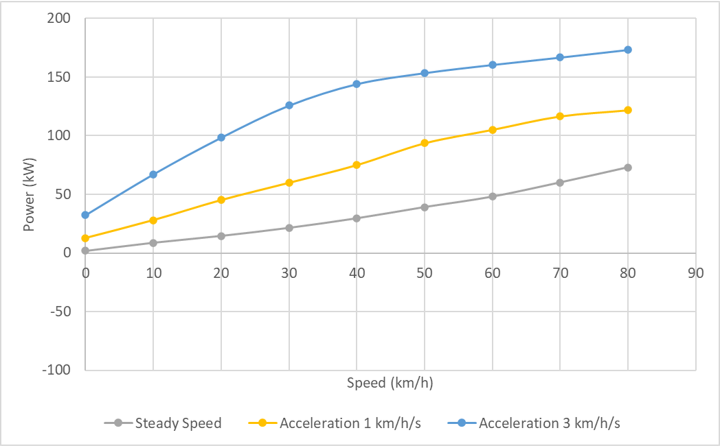
The power required to accelerate is, unsurprisingly, significantly higher, reaching above 150kW even at urban speeds. Higher acceleration rates and higher speeds require even more power.

This analysis does not account for differing payload, which has a large impact on energy consumption when accelerating and decelerating.

It is possible that vehicles that reach higher speeds tend to be more lightly loaded, which would explain the flattening of the acceleration power curves at higher speeds.

The effects of payload will be analysed in future reports.

Deceleration

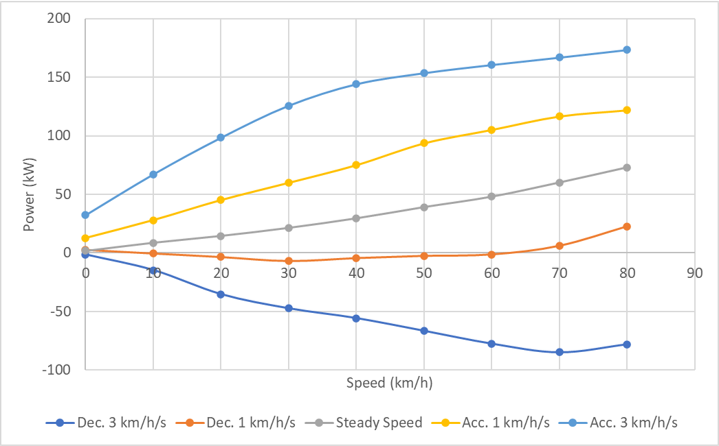
Adding in deceleration shows the power recovered from regeneration. At 1 km/h/s this is negligible because the vehicle will decelerate anyway due to air resistance, in fact at high speeds the drag is so great that power is still required during slow deceleration.

At 3 km/h/s deceleration, significant power is regenerated, but notably not as much as is required to accelerate the vehicle at the same rate. This is partly due to the capability of the motor-generator, but will also be affected by air resistance and the inevitable efficiency losses in the mechanical and electrical systems.

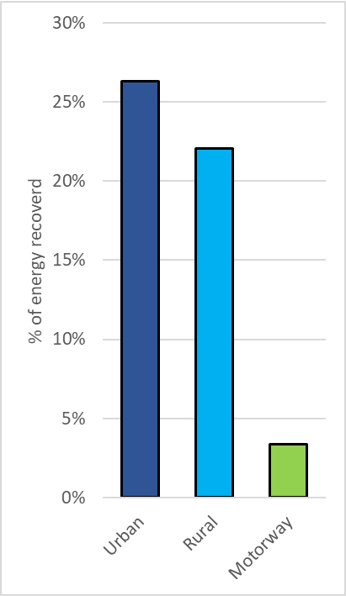
Regeneration power recovery at 3 km/h/s is about 30% to 50% of the propulsion power, depending on the speed.
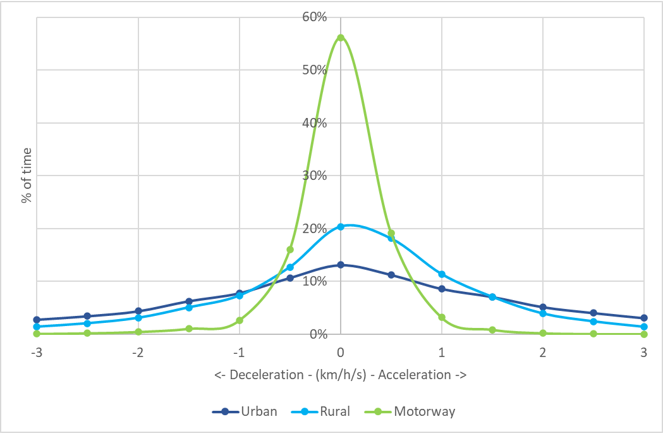
Conclusion

The motorway drive cycle achieves a moderate energy efficiency as its consistent speed means there are fewer high-power accelerations, while fewer decelerations means regeneration is low.

While the urban drive cycle is generally low speed and there is a large proportion of regeneration, the energy requirements are high due to the large number of accelerations.

In the rural drive cycle, without regeneration the efficiency is lower than motorway due to more accelerations, despite the lower average speeds. However more of this energy is regenerated under braking, which means the overall efficiency exceeds motorway. It seems that the mix of speed and accelerations in the rural drive cycle is a sweet spot for efficiency in this vehicle.

Results in the power curve analysis are skewed by factors not yet assessed, especially the payload and weather conditions; and by limitations in the data, especially localised gradients such as humpback bridges which are too small to see in the telemetry data. Factors such as payload, weather and driver behaviour will be assessed further into the trial.

The analysis concludes that trial vehicles tend to do significant distance in motorway style conditions, that the average range is almost 10% higher than expected, and that frequent accelerations seen in urban conditions lead to the lowest efficiency, a finding which could lead to improved efficiency though driver training to mitigate this.